The importance of severity levels in grid inspections
When inspecting power grids, the ability to prioritize repairs is crucial. Not all issues are equal – some require immediate attention, while others pose no immediate threat. Understanding the severity of grid anomalies is key to efficient maintenance and cost savings. That’s where our AI-powered inspection software Hepta Insights makes a difference.
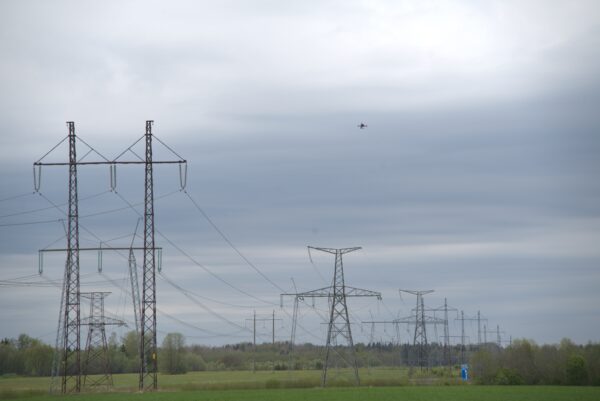
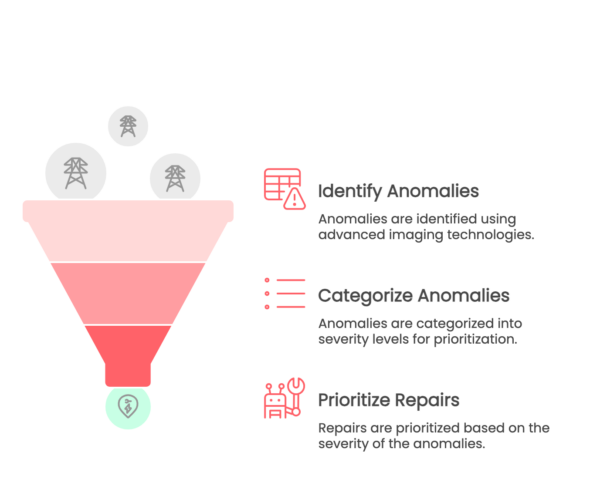
Combining advanced imaging technologies with AI-driven analysis, we help utilities identify, categorize, and prioritize grid anomalies. This ensures that critical issues are resolved promptly while minor problems can be addressed strategically. Our mission is to deliver tailored solutions that improve grid resilience and operational efficiency.
Prioritising power grid anomalies
Severity categorization: why it matters
When inspecting thousands of kilometers of power lines, one critical question arises: Which anomalies demand immediate attention, and which can wait? This is where Hepta Insights’ severity system comes into play, helping grid inspection teams prioritize repairs efficiently and effectively.
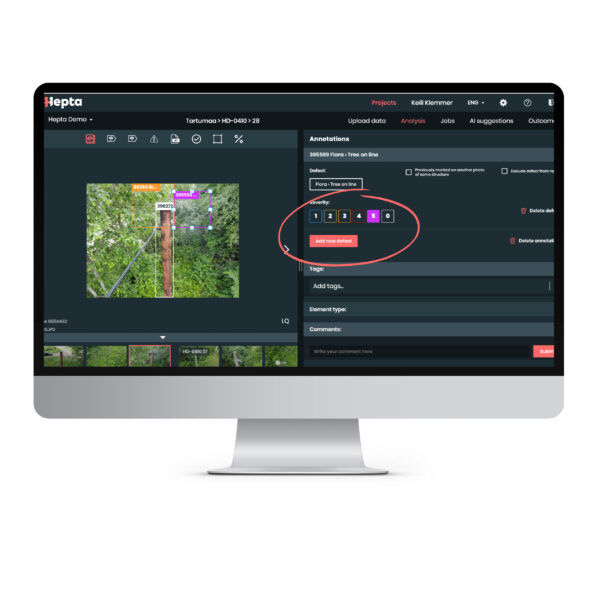
Hepta’s 5-point severity system
Our default approach uses a 5-point severity system to categorize grid anomalies:
Severity 1: Minor issues with the repair plan during the next 5 years.
Severity 2: Moderate problems that require repairing during the next 3 years.
Severity 3: Moderate problems that require repairing during the next 18 months.
Severity 4: High critical issue that requires repairing during the next 3 months.
Severity 5: High critical issue that requires repairing as soon as possible.
However, flexibility is key. Some customers prefer alternative scales, such as a 3-point system or reversed numbering where 1 = most critical. We adapt to these needs, ensuring our software integrates seamlessly with existing processes.
Defining severity levels: AI-powered grid inspection workflow
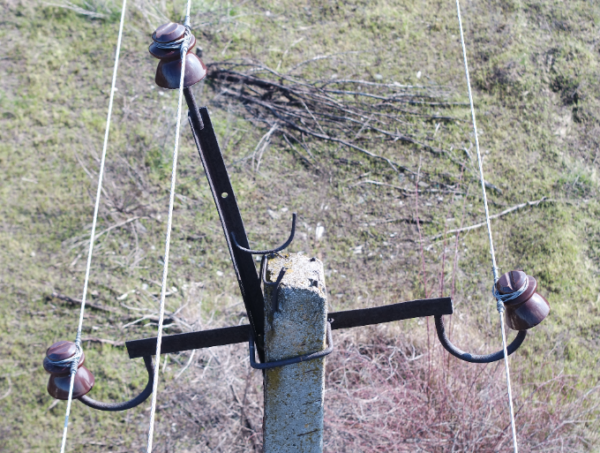
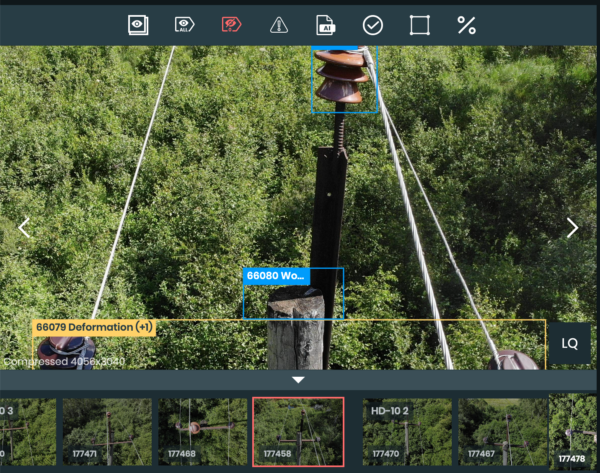
Examples of grid defects by severity level
Accurately classifying defects is essential for prioritizing repairs and ensuring grid stability. Below are real-world examples of different severity levels, helping illustrate how Hepta’s AI-powered grid inspection system identifies and categorizes anomalies for effective maintenance.
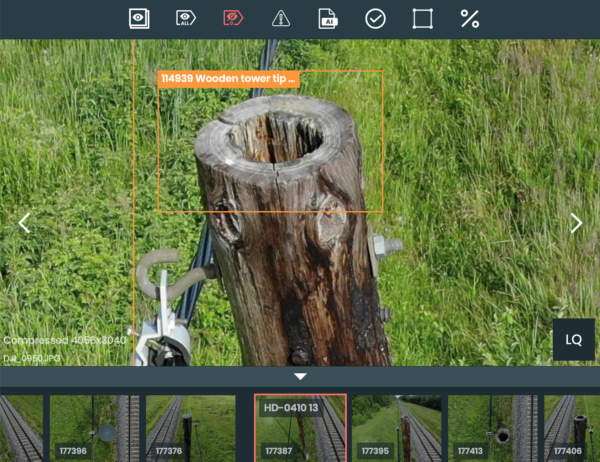
Severity 1 (Low risk, preventative maintenance)
- Wooden tower top missing: The wooden tower top protects against water; a missing cap could lead to faster rotting. There is no immediate danger, but it should be recorded.
- Woodpecker damage: Gradual degradation of wooden structures, requiring long-term monitoring.
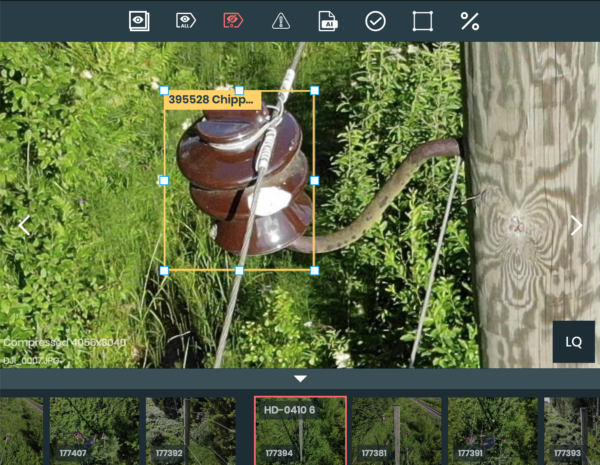
Severity 2 (Minor issues requiring attention)
- Insulator chipped: Cosmetic damage, still functional but should be monitored over time.
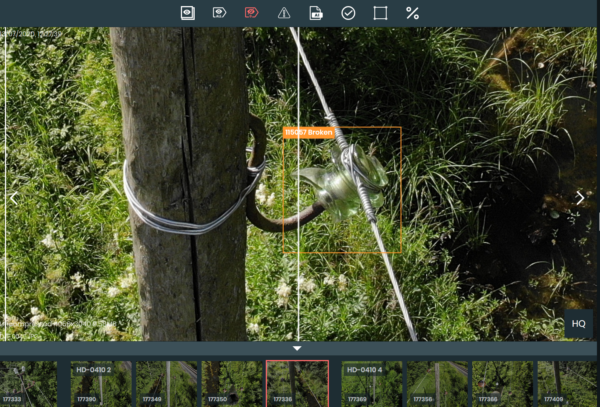
Severity 3 (Moderate issues)
- Wooden tower top rotten: Likely visible only from above, requiring monitoring and eventual replacement.
- Broken insulator: Partial damage, increasing risk of failure but not an immediate outage cause.
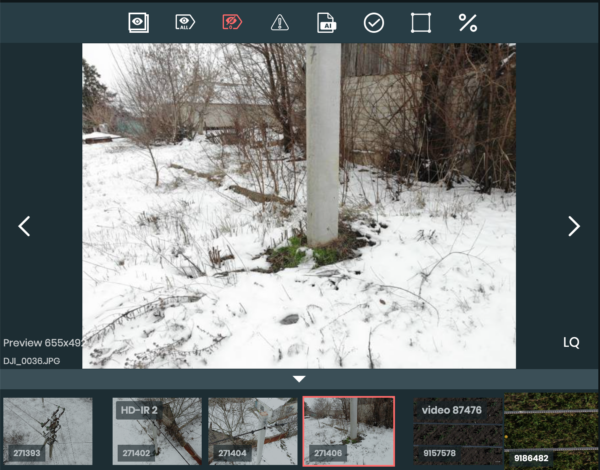
Severity 4 (Critical issues)
- Critical thermal issue: An Overheating component was detected via thermal imaging; it is not visible in RGB images.
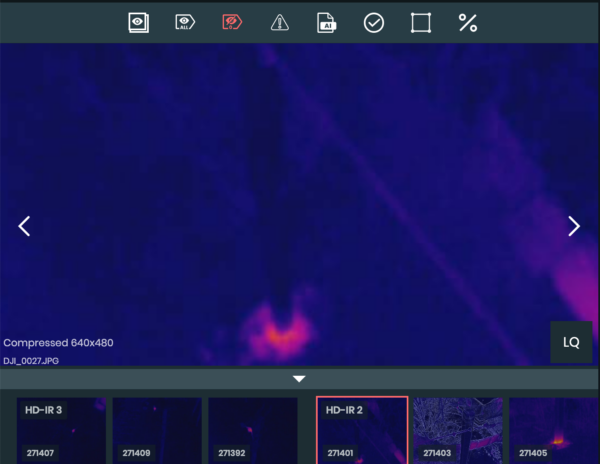
- It is the same tower as the RGB image.
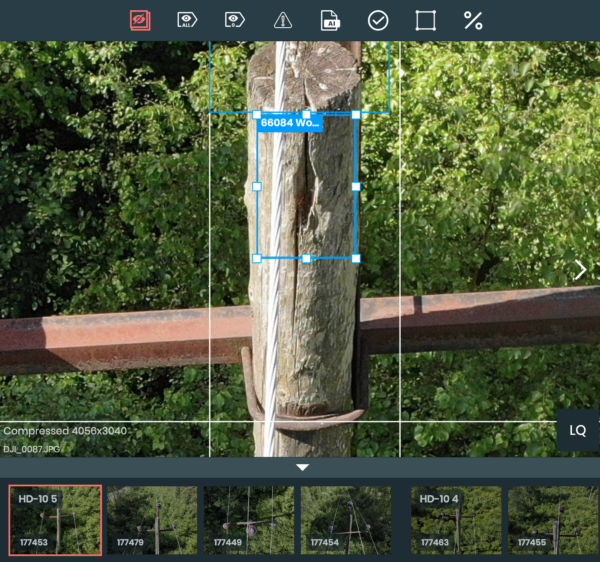
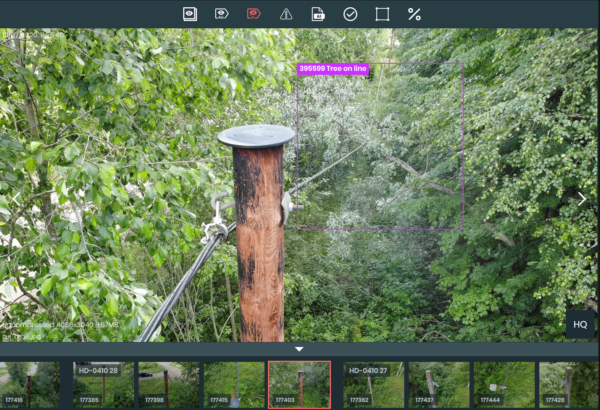
Severity 5 (Most critical)
- Rotten wooden pole: Structural failure risk; immediate replacement is required.
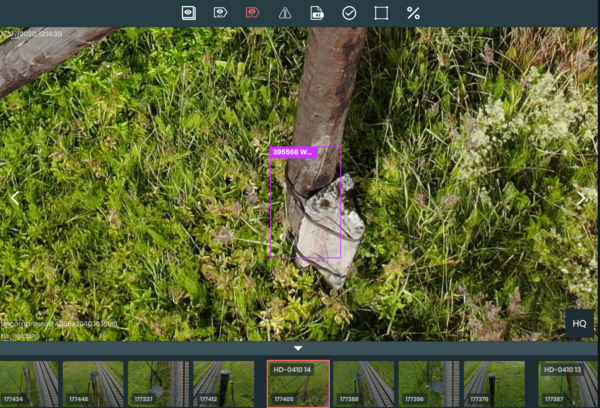
- Fallen tree on a line: Direct contact with power lines, causing outages and safety hazards.
Severity distribution based on our customer base
The severity distribution is divided into five levels. Below, you can see how the volume of anomalies is distributed:
- 1% of anomalies fall into the severity 5 category, requiring immediate intervention to prevent failures.
- 4% of anomalies are classified as severity 4, representing significant risks that need urgent repairs.
- 18% of anomalies fall into severity 3, indicating moderate risks that require scheduled maintenance.
- 57% of anomalies are categorized under severity 2, representing low risks that should be addressed in routine maintenance.
- 20% of anomalies are categorized as severity 1, highlighting minor issues that require long-term monitoring.
This breakdown helps customers allocate resources more effectively, ensuring that the most critical issues are addressed while planning for long-term grid stability.
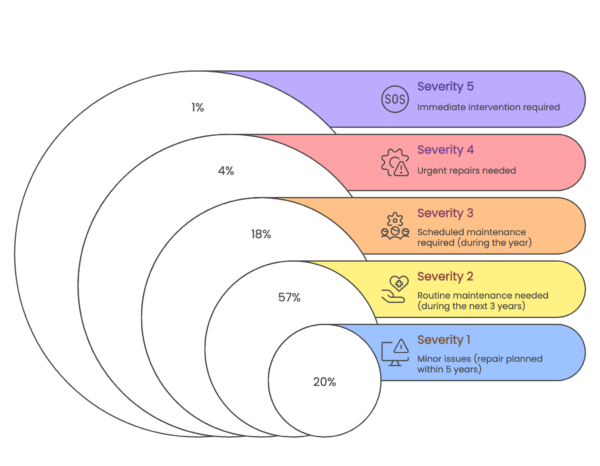
Anomaly severity breakdown based on our customer base
Conclusion: Adapting to customer needs
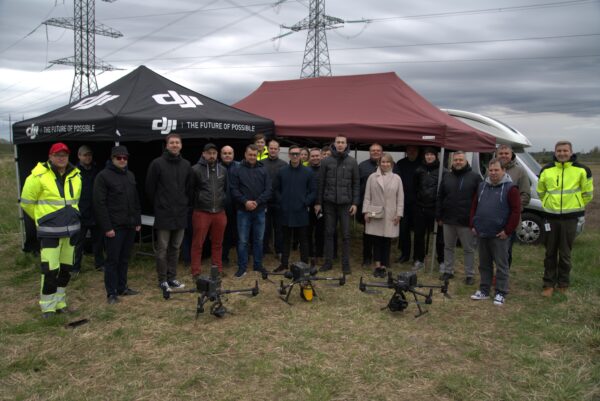
Our solutions have been adopted by over 30 DSOs and TSOs in 23 countries, inspecting more than 3000 kilometers of power grid every month. These inspections lead to measurable results, like improving SAIDI scores by 300% (DTEK Grids) and reducing inspection cycles from 7 to 2.5 years (Enefit Connect).
With this commitment to measurable impact, we’re helping utilities save an average of €3,000,000 annually. Central to this success is our ability to work closely with our clients. We deliver tailored solutions that align with your unique operational challenges. Whether you prefer a 5-point severity system, a 3-point scale, or another approach, our software adapts to your needs, ensuring that every inspection delivers actionable results.
Are you interested in learning how Hepta’s insights can transform your grid operations? Schedule a demo today to see how our AI-powered solutions can save time, reduce costs, and enhance grid resilience.
12.03.2025